On October 1, FPIs net sold ₹95.7 billion of equities. It was even higher, at ₹96.35 billion, on October 5. But these figures paled on Friday, October 9, when FPIs dumped ₹129.43 billion worth of stocks, per NSDL data.
How significant are these numbers?
The daily average FPI selling in the worst month in recent times - September 2026 - was ₹60 billion. Other months were nowhere near as bad. The sales clearly accelerated in October, even as the benchmark Nifty-50 hit a new 18-month low on October 8.
But there are two nuances worth getting into:
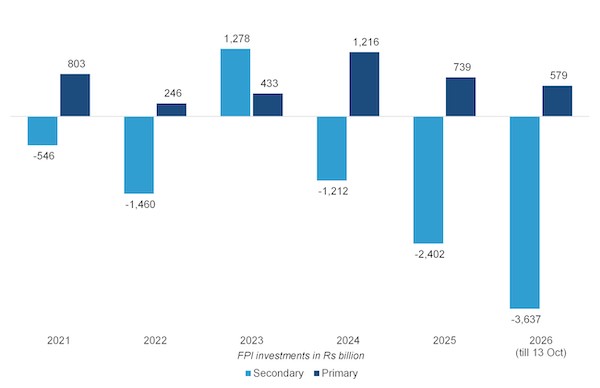
1. There is a misconception that FPIs brought in a large part of what they sold in the secondary market back in through the primary (or IPO) market. This is a generous and even flawed assumption, as the data show.
2. It is also instructive to see what mutual funds have been up to over the last five years as FPI selling grew by leaps and bounds.
Left Pocket-Right Pocket
In the past five years, FPIs’ secondary outflows came back in as primary inflows only in 2021 and 2024. In 2025 and 2026 YTD, in particular, FPIs showed an unprecedented aversion to India.
Source: NSDL, author calculations
Accelerated FPI selling in the secondary market corresponds with shrinking primary market investment, indicating a secular aversion to Indian equities. Debunking the argument that FPIs love primary offerings was fairly easy. Now for the second bit.
Indian mutual funds have enthusiastically lined up on the other side of the FPI trades, and then some.
Plugging The Gap
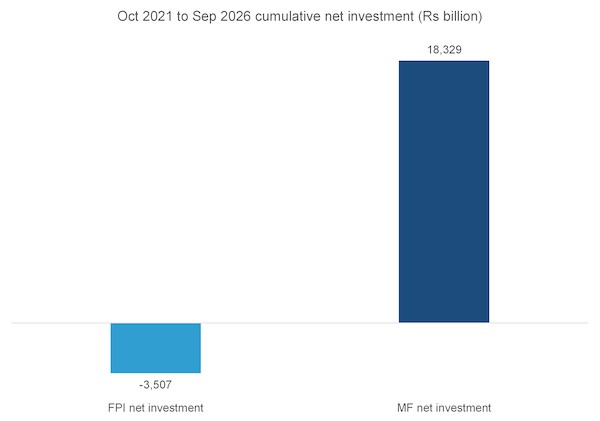
While it is common knowledge that domestic institutions, and specifically mutual funds within this category, have more than matched FPI selling, it is instructive to see how much.
Source: SEBI, author calculations
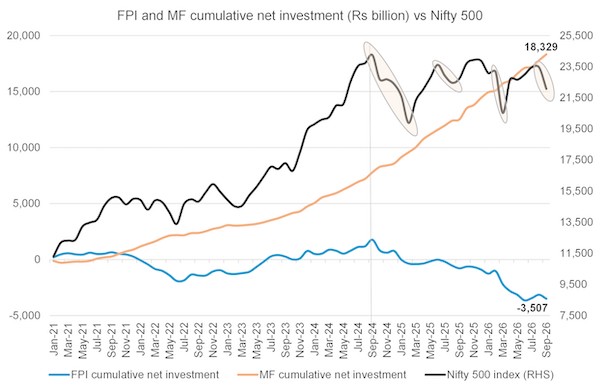
Mutual funds have gone well beyond plugging the FPI hole. By a disproportionate factor of 5.2x, in fact. To what end? Equities have tanked despite this massive spurt in mutual fund buying. And this extends well beyond the top-50 stocks.
Source: NSE, NSDL, SEBI, author calculations
While 5.2x is a striking number, one cannot conclude that mutual fund investment was ineffective—more on this in a bit.
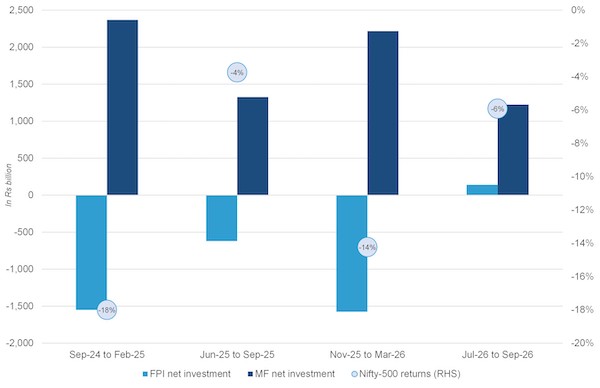
Still, it is instructive to look at each of the four big slumps since September 2024, when the sahi hai mutual funds bought substantially (monthly average of ~₹400 billion).
Source: NSDL, SEBI, NSE, author calculations
- Sep-24 to Feb-25: Mutual funds net invested 53% more than FPIs pulled out in this phase, and yet the broader markets fell 18% in just five months, the worst fall in recent times
- Jun-25 to Sep-25: In this phase, characterised by a more moderate fall in the Nifty-500, mutual fund net buying was more than 2x that of FPI net sales
- Nov-25 to Mar-26: Similar to the first negative phase above, mutual fund investment outnumbered FPI selling and still the index fell 14% in four months
- Jul-26 to Sep-26: In this anomalous phase, both FPIs and mutual funds net bought, but markets still fell 6% in just two months.
The only conclusion from the above is that strong mutual fund net investment did not moderate market corrections. There is scope for nuance, though, as always.
To what end?
One can always argue the counterfactual—how much more would the market have fallen without the substantial mutual fund investment? The answer: perhaps a lot more than it did; perhaps being the operative word.
Here’s why: since January 2021, mutual funds have net sold in only three months (February 2021, July 2022, and February 2023). The index returns in these months were 7.8%, 9.5%, and -2.8%, respectively. Coincidentally (or otherwise), FPI investment was positive in the first two instances. Make of it what you will.
Then there’s a fair, though somewhat simplistic, counterargument that many market mavens like Shankar Sharma offer: isn’t the copious corpus of mutual funds, and their ever-ready eagerness to deploy it, simply giving FPIs an exit option they otherwise wouldn't have had? In other words, if mutual funds hadn't gone gung-ho, FPIs would never have sold, because there would have been no one to sell to.
Nonetheless, someone was eager to buy, and so FPIs did sell. And why wouldn’t they?
On the one hand, they have a shrinking yield differential between Indian equities and US Treasuries, wherein FPIs are left with little to no incremental gains over investing at home, after transaction costs (read: STT), capital gains tax, currency losses, and hedging costs.
Mutual funds' outsized appetite only adds the ability to their willingness to sell. Irrationality aside, would you act any differently if you were in their place?
The question of how vital FPI flows are for Indian equities has no clear-cut answer. Fundamentally, some argue that every buy order has a corresponding sell order, so how can FPI buying lift markets? Fair point. But I guess there's some value in the stamp of foreign investor approval. Especially after a long, dry summer of selling.
But let’s look at the data, not hypothesise conceptually.
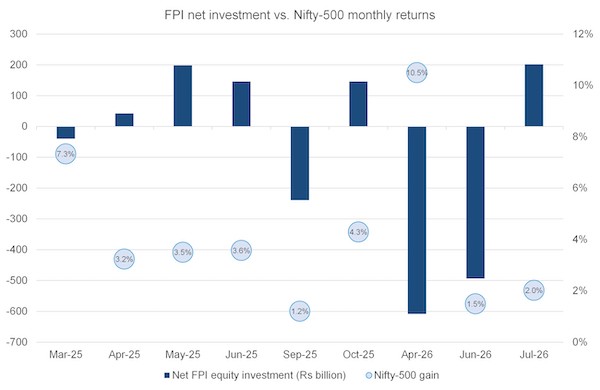
There’s an interesting sub-trend for those who trivialise the importance of FPI inflows, if you zero in on the few bouts of upward movement in equities over the last two-odd years.
Source: NSDL, NSE, author calculations
The big anomalies of April and June 2026—where big FPI selling corresponded with positive returns—are not much of an indicator. That’s because FPI selling may have been concentrated in a different market segment (say, Nifty-50). For completeness, let me state here that mutual fund buying in these two months was not unusually large.
Yet, this graph only corroborates the earlier one about the large falls—net positive investment by FPIs doesn’t always lift markets, and selling doesn’t always tank them.
There’s something here for those who like finding patterns in clouds, though. From the graph above it does loosely look like index moves and FPI investment are positively correlated, with six out of nine positive months showing flat-to-positive FPI net investment. However, correlation is not causation, as anyone who has studied statistics will tell you. We may also be making the mistake of conflating cause and effect—is FPI buying leading to positive returns, or is positive sentiment pulling in FPI money? Hard to say conclusively.
Some basic statistical measures provide a clue, though. These measures don't give a black-and-white answer on the importance of FPI flows, but show how trends have moved on the way up and now on the way down.
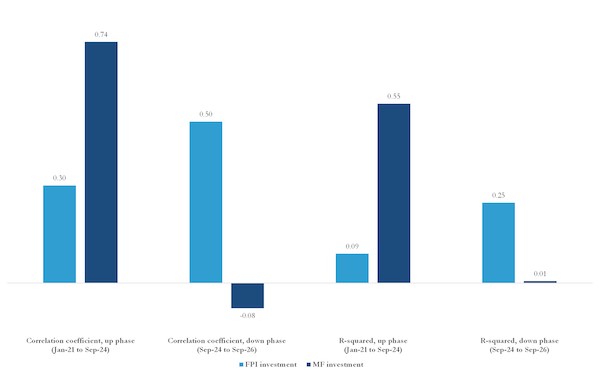
The correlation coefficient measures the strength and direction of a linear relationship between two variables. It ranges from +1 (perfect positive linear relationship) to -1 (no linear relationship)
R-squared is the proportion of variance in the dependent (response) variable that is explained by the independent (predictor) variable in a regression model. It ranges from 0 (model explains none of the variability of the response data) to 1 (model explains all of the variability).
Source: NSDL, SEBI, NSE, author calculations
The short takeaway from the graph is that positive market returns are strongly linked to mutual fund buying. That relationship weakens considerably on the way down, where FPI investment plays a more deterministic role, though not as strong as mutual funds on the way up. Once again, we need to be mindful of conflation—is FPI selling causing the index to fall, or is a falling index precipitating FPI selling?
There’s also a fair argument that mutual funds have a compulsion to invest once funds come in, whereas market direction is not under their influence. Can we call mutual fund buying futile, then? Probably not.
We can debate this till the cows come home. But the trend stands out—FPI money is punching above its weight, while hefty mutual fund buying isn’t stemming either the tide of FPI selling or falling markets.
.png)