.png)

By Ajay Srivastava
Ajay Srivastava, founder of Global Trade Research Initiative, is an ex-Indian Trade Service officer with expertise in WTO and FTA negotiations.
September 22, 2025 at 3:39 PM IST
India’s export engine to its largest market, the US, is sputtering under the weight of tariff shocks. In just three months — from May to August 2025 — merchandise exports to the US have plunged 22.2%, sliding from $8.8 billion to $6.9 billion.
This is not a one-off slump but a sustained decline coinciding with the steep escalation of US tariffs — from 10% until early August, to 25% from August 7, and a punishing 50% by the end of the month.
A detailed GTRI analysis shows that the pain is uneven: some tariff-free products are collapsing despite facing zero duties, while several highly-taxed sectors are showing surprising resilience, exposing a complex mix of demand slowdown, price sensitivity, and shifting US consumer preferences.
Tariff Categories
|
Impact of U.S. Tariffs on India’s Exports to USA (May vs. Aug 2025) |
||||||
|
Category |
Description |
Share in Aug 2025 (%) |
Monthly export data-US$ bn |
Key Products |
||
|
May-25 |
Aug-25 |
Growth (%) |
||||
|
A |
Tariff-Exempt Items |
28.5 |
3.37 |
1.96 |
-41.93 |
Smartphone, Pharmaceuticals, APIs, petroleum products |
|
B |
High Uniform Tariffs (All Countries) |
8.8 |
0.63 |
0.60 |
-04.04 |
Iron, steel, aluminum, copper (Tariff @50%), Auto Component (Tariff @50%) |
|
C |
High 50% Tariff on India (Lower on Others) |
62.7 |
4.82 |
4.30 |
-10.80 |
Remaining Products (Textiles, gems and jewelry, agriculture, machinery, chemicals etc.) |
|
Total |
|
100 |
8.83 |
6.87 |
-22.22 |
|
Category A – Tariff-Exempt Items See the Deepest Decline
Tariff-free products, which account for 28.5% of India’s August exports, posted the sharpest contraction of 41.9%, falling from $3.37 billion in May to $1.96 billion in August.
• Smartphone exports (HS 85171300) — India’s largest export to the U.S. — plunged 58%, dropping from $2.29 billion in May 2025 to $964.8 million in August.
The fall was steady month by month: June $2.0 billion, July $1.52 billion, and then the sharpest drop in August.
In 2024-25, the US remained India’s top smartphone market with $10.6 billion imports (44% of India’s global $24.1 billion exports), followed by the EU at $7.1 billion (29.5%).
Foxconn and Tata electronics account for most exports of smartphones to US. We need to find out reasons for falling exports to US. Is production shifting back to China or Vietnam for newer models or Component shortages has hit Indian assembly plants.
• Pharmaceuticals also weakened, with exports dropping 13.3%, from $745 million in May to $646.6 million in August 2025.
• Petroleum oil rose 0.6% to $292.6 million, supported by firm crude prices and steady energy demand.
Tariff-exempt exports collapse is a puzzle. It is alarming and counterintuitive — these products face zero US tariffs, yet they have seen the steepest decline. This demands urgent investigation to uncover the real reasons that are driving the fall.
Category B – Mild Decline Despite High Tariffs
Products under Category B — metals and auto components— fell only 4%, from $630 million in May to $600 million in August.
• Aluminium (HS 76): Down 19% to US$ 83.1 million
• Iron & Steel (HS 72): Down 13.1% to US$ 43 million
• Copper (HS 74): Down 10.2% to US$ 28.5 million
• Auto Components (HS 8708): Down just 2% to US$ 179.6 million
Because tariffs are equal for all suppliers, India’s competitiveness has not been uniquely harmed — the drop is mainly due to weaker U.S. industrial demand, not loss of market share.
Category C – 50% Tariffs Hit Labour-Intensive Exports
Category C accounts for 62.7% of India’s exports to the US and faced the sharpest tariff disadvantage. Exports fell 10.8%, from $4.82 billion in May to $4.30 billion in August 2025. The decline is concentrated in labour-intensive sectors, which are most exposed to price competition.
1-Gems & Jewellery
Jewellery exports fell 9.1% to $228.2 million. Of this, diamond-studded gold jewellery dropped sharply by 25.5%, and cut and polished diamonds fell 15.2% to $164.2 million, putting pressure on Surat’s diamond industry.
Interestingly, lab-grown diamond jewellery rose 8.5%, while lab-grown diamonds surged 40.7%, reflecting a shift in US consumer preference toward affordable, sustainable alternatives.
2-Solar Panels
Exports of solar panels fell 34.6%, from $202.6 million to $132.4 million. India risks losing market share to China, which faces only 30% tariffs, and Vietnam, which enjoys even lower tariffs at 20%.
3-Seafood (Shrimp)
Seafood shipments plunged 43.8%, from $289.7 million to $162.7 million.
Vannamei shrimp, India’s largest seafood export, dropped 52.2% to $98.6 million, severely impacting employment in coastal processing clusters.
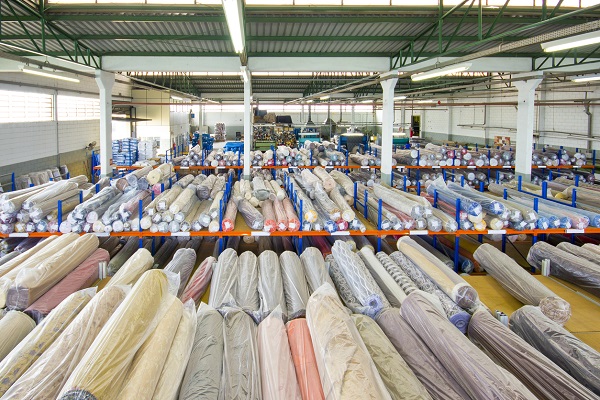
4-Textiles, Garments and Made Ups
India’s textile, garment, and made-up exports to the US fell 9.3%, sliding from $943.7 million in May 2025 to $855.5 million in August 2025.
Garments were the hardest hit. Apparel exports to the US fell 14.3% to $441.9 million. Knitted apparel declined 6.7%, while non-knitted apparel dropped a sharper 22.2%. Within this, girls’ suits plunged 45.4% and cotton dresses collapsed 66.7%, pointing to a major demand contraction in fashion retail.
Home textiles were the only bright spot, rising 14.2% to $ 263 million, driven by steady demand for furnishings, towels, and bedding.
Fabric, yarn, fibre and carpets fell 23.9%. While carpets dropped 18.3%, and technical textiles collapsed 56.7%, signalling a severe loss in high-value and specialised exports.
Chemical exports fell 15.9% to $451.9 million between May and August 2025. The sharpest contraction was seen in agrochemicals, insecticides, and herbicides, which plunged 26.7% to $77.5 million. Exports of essential oils, cosmetics, and related products also declined 8.8% to $42.2 million.
Agricultural exports saw a broad-based decline between May and August 2025. Processed food, sugar, and cocoa preparations fell 13.9%, dropping from $89.7 million in May to $77.2 million in August. Cereal exports contracted 7.2% to $32.5 million, while dairy products saw a sharper 31.1% fall to $16.8 million. The steepest drop was recorded in edible oils, which plunged 69.7% to just $8.2 million, reflecting lower US buying and possibly higher tariffs or competition from cheaper suppliers.
September Outlook
August data only partly reflects the impact of higher tariffs — India paid 10% tariffs until August 6, 25% until August 27, and 50% only after August 28. September will be the first full month where all Category C exports face 50% tariffs, meaning the declines in textiles, gems and jewellery, shrimp, chemicals, and solar panels could deepen further.
India’s exports to the US have fallen for a third straight month — a predictable outcome of steep tariffs
More worrying is the unexpected crash in tariff-free exports like smartphones and pharmaceuticals, threatening to derail India’s flagship PLI success story. Policymakers and industry must urgently probe the causes and act before this slide deepens.
Industry bodies are urging New Delhi to act. They want interest subsidies under the interest equalisation scheme, faster duty remission, and liquidity support.
The government has cut GST rates to boost consumption, but export-specific relief is still missing.
On trade negotiation front, India must firmly protect its red lines on agriculture, dairy, GM feed, and regulatory sovereignty — US demands will keep escalating and can never be fully met.
More From BasisPoint