.png)
Gurumurthy, ex-central banker and a Wharton alum, managed the rupee and forex reserves, government debt and played a key role in drafting India's Financial Stability Reports.
January 5, 2026 at 2:25 AM IST
The Reserve Bank of India’s latest Financial Stability Report is, in parts, refreshing, despite its familiar shortcomings. The improvement owes less to the prose and more to the quality of charts, tables, and underlying data, which often say far more than the accompanying narrative.
Stress testing, the central pillar of global bank regulation, remains the symbolic core of the FSR. Yet its scope and relevance have not evolved meaningfully in India’s case. Even as the report sprawls across an expanding universe of risks — NBFCs, markets, fintech, climate exposures, and household leverage — the stress-testing framework itself remains narrowly constructed and largely unchanged.
At the system level, the RBI continues to publish top-down stress tests focused primarily on credit risk under baseline, adverse, and severely adverse macroeconomic scenarios. These are aggregate, static balance-sheet exercises designed to assess whether the banking system, taken as a whole, remains above minimum capital requirements. They do not identify bank-level failures, comprehensively model second-round or contagion effects, or mechanically trigger regulatory actions. They seem to simulate the impact of a gradual macro driven (mild) worsening of inflation- growth dynamics rather than the impact of a sudden idiosyncratic growth shock - a version of stress that is generally followed in some of the major G-7 countries.
Crucially, India still lacks a formal, published pass–fail stress-testing regime. Unlike the US CCAR or the EU’s SREP, there are no explicit post-stress capital thresholds, no automatic restrictions on dividends or buybacks, and no rule-based capital add-ons. Supervisory responses do exist, but they remain discretionary, opaque, and case-specific.
This design is not accidental. In a system dominated by public sector banks, recurring recapitalisation needs, and relatively shallow capital markets, hard pass–fail regimes would force politically and fiscally uncomfortable choices. The trade-off, however, is clear: stress tests reassure more than they challenge. As operational, cyber, and climate risks grow in prominence, stress testing without clear consequences risks becoming an exercise in narrative management rather than genuine resilience building.
One puzzling omission in the latest report is the Systemic Risk Survey, which has quietly disappeared without explanation. Whether the survey is now considered uninformative, redundant, or inconvenient is unclear. Some transparency here would have helped; silence only encourages sceptical interpretations.
While low nominal growth is a pervasive concern, impacting government revenues, influencing fiscal deficit, corporate earnings etc., one can see only passing references and not much of a debate.
Last but not the least, with much of credit happening outside of banking sector but with strong linkages with the latter, the stress tests need to evolve to address the spillovers of risk from the non-banking sector to the banking sector, since the stress test currently undertaken for even regulated NBFCs is at best sketchy
It is therefore more instructive to turn directly to the charts, tables, and data, where the report’s real insights lie.
A dominant theme running through the FSR is the persistence of fiscal risks and elevated bond yields that appear increasingly impervious to benign monetary policy actions. Charts 1.11(c) and 1.25(c) are particularly revealing. Despite a series of rate cuts and liquidity-easing measures, the sovereign yield curve has steepened. While there is much discussion about transmission to deposit and lending rates, the sovereign curve has refused to cooperate, instead twisting in ways that defy conventional expectations.

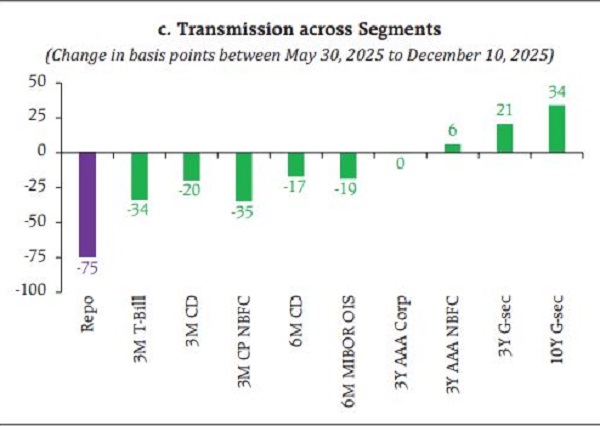
This reinforces a point made by me in my column earlier in the context of recent monetary policy decisions: yield curve management operations may become unavoidable, alongside efforts to reduce the weighted average maturity of government issuances.
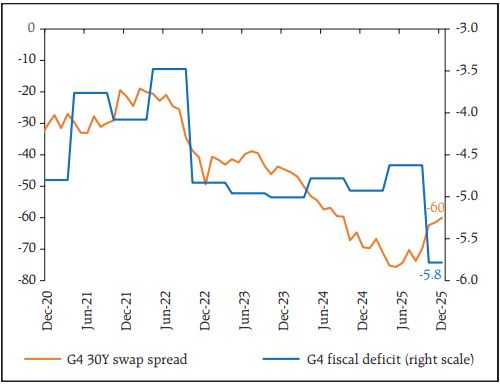
India is not alone in this predicament. The United States is experiencing a similar dynamic, where concerns over fiscal sustainability increasingly dominate the behaviour of sovereign bond yields and spreads, overwhelming the impact of monetary easing (Chart 1.24). Even as major sovereign borrowers shift issuance towards the short end of the curve, long-end yields continue to firm. When juxtaposed with Chart 1.7 on widening swap spreads, the picture becomes clearer. With TIPS suggesting that long-term inflation expectations remain anchored, the most plausible explanation for these patterns is mounting fiscal anxiety.
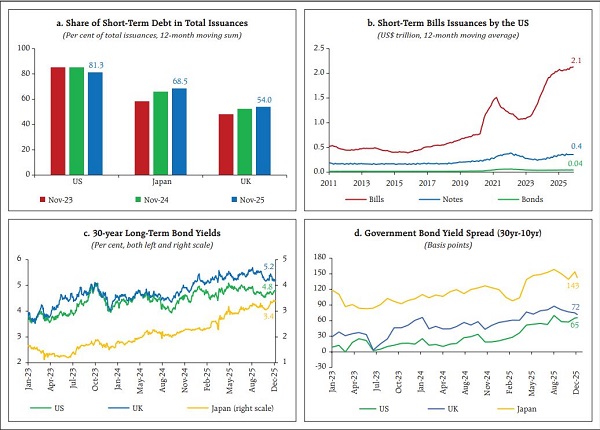
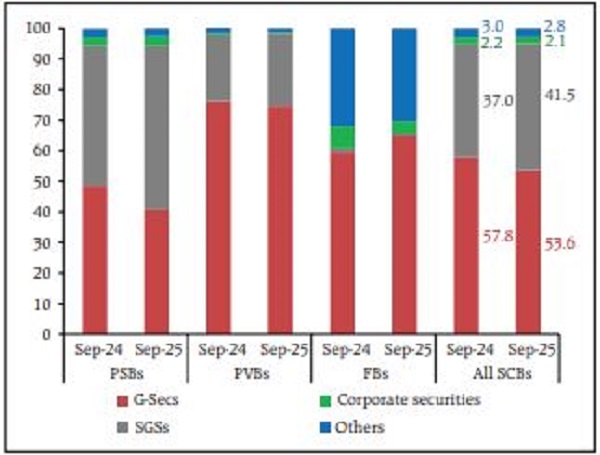
Returning to India, a related concern is the apparent demand deficiency at the long end of the curve, even among traditional long-term investors. Tables 1.1 and 1.2 show a clear preference for equities over long-dated bonds. State government loans appear to be cannibalising demand for central government securities, and this pressure could intensify if more social sector spending is devolved to states. From a regulatory standpoint, both central and state government bonds qualify as HQLAs; once securities sit in HTM buckets, the distinction matters little. From a market-clearing perspective, however, it matters a great deal. This is further corroborated by Chart 2.16 which shows that the share of state loans in HTM category is rising.
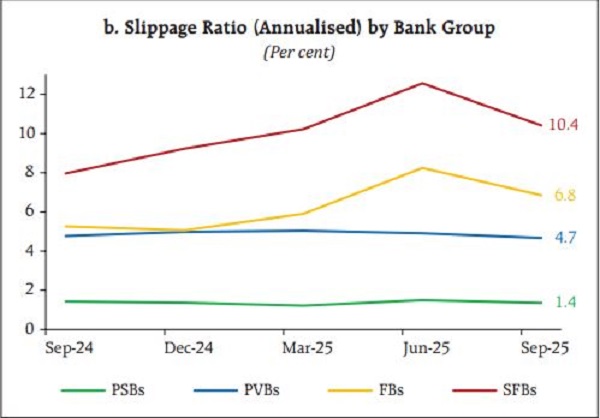
The banking data also invite scepticism. Chart 1.58, which shows PSB slippages in unsecured space , looks almost too good to be true, raising questions about sustainability rather than signalling unambiguous improvement. Even if it is true, some explanation is due for the large private banks’ contribution to the slippages, if not for the better performance of the PSBs. The issue becomes more interesting when read with the Chart 1.81 – and the related narrative (paragraph 1.74), which says that while banks are increasingly acquiring assets originated by NBFCs to scale retail portfolios, boost yields, and meet priority-sector norms, PSBs’ acquired pools have underperformed their own originations, especially in direct assignment and co-lending with higher loan losses even as PVBs’ acquired pools have fared better. Moreover, nearly 80% of such acquisitions are concentrated among a few NBFCs, raising the risk of correlation and stress amplification.
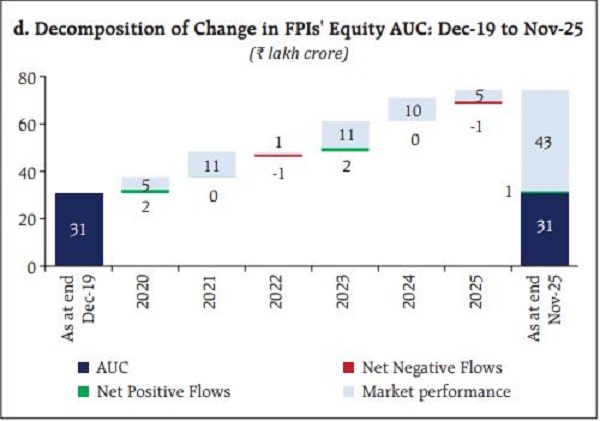
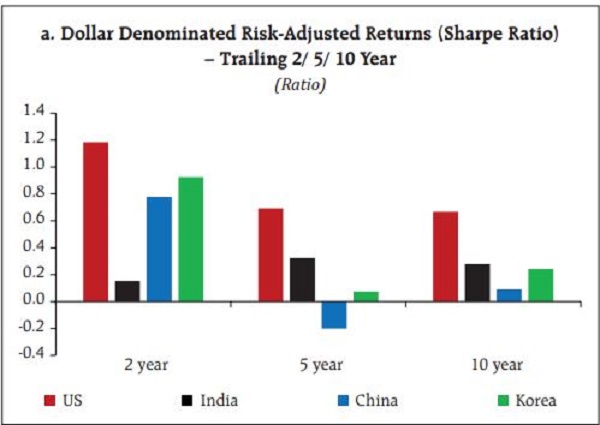
For those wondering why foreign institutional investors have been persistent sellers, Chart 1.31 (d) offers useful clues. Even as of end-November 2025, FIIs were sitting on substantial unrealised gains, making profit-booking a rational response. Chart 1.31(a) adds another layer: once long-term capital gains tax and securities transaction tax are factored in, Indian equities may be less attractive to foreign investors than headline returns suggest. STT on derivatives may be defensible, but its application to cash market transactions remains harder to justify at these critical times.
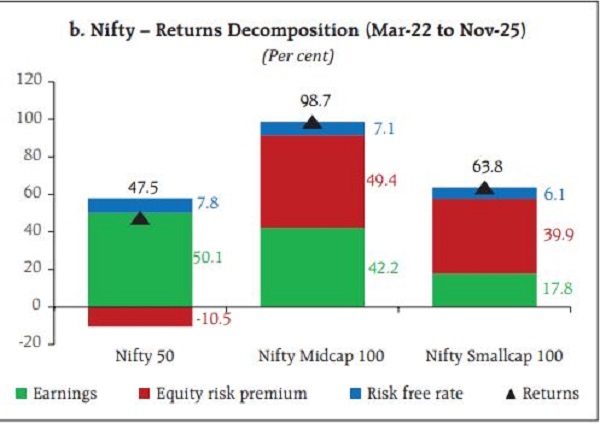
Finally, the valuation debate resurfaces in Chart 1.33(b), which tracks large-, mid-, and small-cap equity risk premia. A note of caution is warranted here: equity risk premia are meaningful only over sufficiently long horizons. For me in any case, despite liquidity differentials and style cycles, the distinction ultimately collapses into a simpler one - good stocks and bad stocks.
In the end, the FSR’s strength lies not in its comforting narratives but in its data, which quietly point to deeper structural and fiscal stresses that monetary policy alone cannot resolve. Read carefully, the charts tell a more candid story than the text surrounding them. I might have missed quite a few!
More From BasisPoint