.png)


Datametricx is a veteran journalist tallying the macro game, keeping score of the numbers that shape India’s economy and policy.
August 29, 2026 at 5:28 AM IST
India’s industrial growth slowed but remained relatively strong in July. The Index of Industrial Production grew 6.7% year on year in July, down from an upwardly revised 8.8% in June. The slowdown was mainly due to a contraction in the mining and quarrying sector and an unfavourable base effect. Growth in all sectors, except water supply, sewerage and waste management, slowed in July from the previous month.
Mining and quarrying output contracted 0.9% in July compared with growth of 1.6% in June. The sector’s output has contracted in six out of the last seven months. The weakness in the mining sector is unsurprising given the continued contraction in crude oil and natural gas output.
The manufacturing sector, which accounts for 76.1% of the overall index, grew 7.3% in July compared with 9.5% in June, while the electricity and gas supply sector expanded 8.7% from 11.3% a month earlier. Water supply, sewerage and waste management grew 7.4% in July compared with 6.1% a month earlier.
Within the use-based sectors, capital goods and consumer durables continued to outperform others, growing at 16.1% and 10.5%, respectively, in July. Capital goods grew in double digits for the fourth consecutive month, while consumer durables did so for the second consecutive month. Consumer non-durables goods contracted 1.0% in July, the fourth contraction in the last seven months.
The buoyant factory output growth in June and July contrasts with the weakness reflected in the manufacturing purchasing managers’ index during the period.
Sales growth of private companies accelerated in the April-June quarter to its fastest pace in 15 quarters, according to a Reserve Bank of India study of 3,247 listed private non-financial companies. Overall sales increased 19.4% on year in April-June, up from 13.9% in the previous quarter and 5.5% a year ago, led by growth in the manufacturing and non-IT services sectors. Net profit growth of private companies, however, slowed to 14.1% in April-June from 27.1% a quarter earlier.
Sales of manufacturing companies expanded 21.4% in April-June, up from 14.5% in the previous quarter, mainly driven by the automobiles, petroleum, and electrical machinery industries. Sales growth at IT companies rose to 14.8% from 9.9% a quarter earlier, while sales growth at non-IT services companies moderated marginally to 19.7% from 20.3% a quarter earlier.
Raw material expenses for manufacturing companies increased 27.5% in April-June, up from 18.3% a quarter earlier. However, the raw material-to-sales ratio declined marginally to 58.1% in April-June from 58.5% in the previous quarter. Staff cost at manufacturing, IT and non-IT services companies rose 12.4%, 7.6%, and 11.2%, respectively, in April-June.
Despite a significant increase in input costs, operating profit growth of manufacturing companies improved to 21.3% in April-June from 9.4% in the previous quarter. Operating profit growth at IT and non-IT services companies also improved to 19.9% and 12.7%, respectively, in April-June.
Housing prices continued to rise for the fifth consecutive quarter in April-June. On a year-on-year basis, the Reserve Bank of India’s all-India House Price Index increased 3.7% in April-June, down from a 4.5% rise a quarter earlier. The rise was driven mainly by gains in Chandigarh, Lucknow, and Thiruvananthapuram.
Renewable energy generation, excluding large hydroelectric projects, rose 17.3% on year to 38.50 billion units in July, driven by a 49.4% jump in solar power generation to 18.08 billion units. Wind generation increased 5.3% to 18.51 billion units. Electricity generation from large hydro projects fell 18.1% to 17.75 billion units. Consequently, renewable energy generation, including large hydroelectric projects, rose only 3.2% to 56.25 billion units in July.
Total electricity generation in July, including thermal and nuclear sources, increased 9.5% to 182.52 billion units. Renewable sources accounted for 30.8% of total electricity generation in July, down from 32.7% a year earlier. The decline in the share was mainly due to lower generation from large hydroelectric projects during the month.
India’s coal production growth rose to an 11-month high of 7.6% in July from 1.4% a month earlier. In absolute terms, coal output in July was the lowest in 10 months at 69.82 million tonnes, compared with 80.09 million tonnes a month earlier. Coal dispatches rose 18.1% to 86.91 million tonnes, the fastest growth in 35 months. Coal demand has picked up in over the last few months due to an acceleration in thermal power generation. Coal dispatches to the power sector increased 16.4% on year to 68.72 million tonnes in July. The power sector accounts for about 80% of total coal dispatches.
Net foreign direct investment inflows into India turned positive at $1.35 billion in June, compared with an outflow of $79 million in May. The sequential rise in net FDI was primarily on account of a sharp increase in gross FDI, which rose to $9.30 billion in June from $6.07 billion in May. Net FDI and gross FDI inflows were $2.29 billion and $9.61 billion, respectively, in June last year.
FDI repatriation rose to $5.82 billion in June from $3.70 billion a month earlier, while overseas investments by Indians declined to $2.13 billion from $2.45 billion.
Overall foreign investment flows recorded a net inflow of $3.80 billion in June, compared with a net outflow of $4.83 billion in May, as net portfolio investment turned positive at $2.45 billion from a net outflow of $4.75 billion a month earlier.
Net FDI inflows in April-June rose 64.5% on year to $7.84 billion, while gross FDI inflows increased 14.8% to $30.66 billion.
The rupee’s real effective exchange rate rose in July as higher domestic inflation relative to major trading partners outweighed the rupee’s depreciation in nominal effective terms. The 40-currency trade-weighted real effective exchange rate index rose to 91.75 in July from 91.26 a month earlier.
The latest data showed that the rupee remained undervalued relative to the currencies of its major trading partners. The rupee depreciated 0.8% against the US dollar in July owing to a rise in crude oil prices amid tensions in West Asia.
India’s foreign exchange reserves hit record high of $729.33 billion as of August 21, surpassing the previous high of $728.49 billion touched on February 27. The rise follows the RBI's June 8 launch of a special dollar/rupee swap facility to attract inflows through FCNR(B) deposits, external commercial borrowings and overseas foreign currency borrowings. On August 22, the RBI said these measures had mobilised nearly $73 billion till August 21.
Reserves rose $12.42 billion on the week, led by a $9.48 billion increase in foreign currency assets to $591.33 billion. Gold reserves rose $2.80 billion to $114.22 billion.
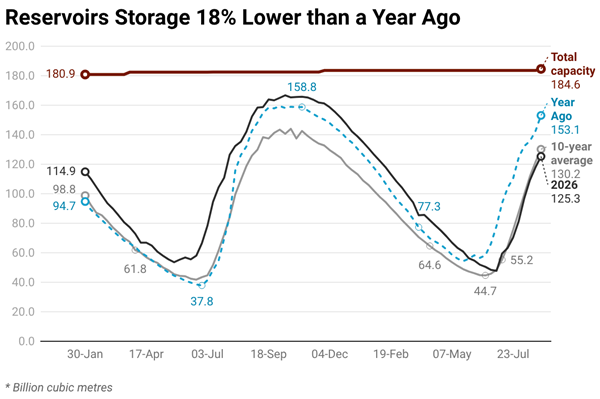
Reservoir storage increased but remained below historical averages. As of August 27, live storage in 176 reservoirs stood at 125.30 billion cubic metres, up 7.53 billion cubic metres from a week earlier. Live storage was at 68% of total reservoir capacity. However, storage was 18% below last year’s level and 4% lower than the 10-year average. Reservoirs are replenished during the southwest monsoon.
Southwest monsoon rainfall remained deficient in most parts of the country. As of August 28, cumulative rainfall across the country was 587.8 millimetres, or 87% of the long-period average. Among the four regions, rainfall was 73% of the long-period average over east and northeast India, 77% in the south peninsula, 89% in northwest India, and 97% in central India. Rainfall was 63% of the long-period average in June, 101% in July, and 85% through August 28.
With the kharif sowing season nearing its end, the area sown so far remained below last year’s level amid deficient monsoon rainfall. The total area sown under kharif crops fell 1.7% year on year to 107.10 million hectares as of August 28. Rice acreage declined 3.4% to 41.41 million hectares. Pulses acreage rose 1.2% to 11.51 million hectares, but oilseed acreage declined 0.5% to 19.05 million hectares. Sugarcane acreage declined 0.7% to 5.85 million hectares, while cotton acreage fell 0.4% to 10.88 million hectares. The area sown so far accounted for 97% of the normal kharif area of 110.45 million hectares.
Coming up
• August 31: Quarterly Estimates of GDP for April-June
• August 31: Government finances for April-July
• September 1: GST collections for August
• September 1: HSBC India Manufacturing PMI for August
Corporate bond issuances fell to ₹1.88 trillion in April-June from ₹2.95 trillion a year earlier amid elevated yields. Average yields on AAA-rated three-year and five-year bonds rose 18 basis points and 13 basis points, respectively, from three months earlier to 7.54% and 7.65% in June.
More From BasisPoint