.png)
Week in Numbers: Tracking India’s Economic Pulse
Early data suggest a sharp uptick in demand in October following GST rate cuts — but can it last? E-way bills suggest otherwise.

Datametricx is a veteran journalist tallying the macro game, keeping score of the numbers that shape India’s economy and policy.
November 8, 2025 at 8:33 AM IST
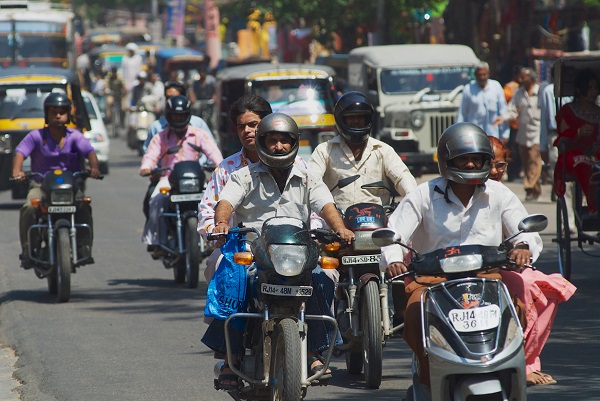
Retail automobile sales surged in October, driven by GST rate cuts, festive buying, and pent-up demand, rising 40.5% year-on-year to a record 4.02 million vehicles — the sharpest pace in three years.
According to the Federation of Automobile Dealers Associations, two-wheeler sales jumped 51.8% to 3.15 million vehicles, passenger vehicle sales rose 11.3% to 557,373, and commercial vehicle sales increased 17.7% to 107,841. This marked record highs for two-wheelers and passenger vehicles, and the second-highest ever for commercial vehicles.
After a muted September during the GST transition, October saw a swift rebound as pent-up demand, festive sentiment, and tax cuts propelled sales to record highs. Rural demand was the key driver: passenger vehicle sales in rural markets grew over three times faster, and two-wheeler sales nearly twice as fast, as in urban areas.
Many consumers had postponed purchases after the government announced GST rate cuts a month before implementation, leading to a surge in pent-up demand. It remains to be seen whether October’s growth was just a blip or if demand will stay buoyant in the months ahead.
Goods and services tax collections rose year-on-year in October despite the rate cuts, though growth slowed to a 52-month low. The GST mop-up rose 4.6% year-on-year to ₹1.96 trillion, the highest in absolute terms in five months.
This was the first month after the government overhauled the indirect tax structure, reducing the number of GST slabs to two (5% and 18%), effective from September 22. GST cess collections declined 37.8% to ₹78 billion, as the government withdrew the levy on most items except tobacco-related products.
Net of refunds, GST collections rose 0.6% to ₹1.69 trillion in October. Net collections in April-October rose 7.1% year-on-year to ₹12.07 trillion — sharply below the 14.2% growth projected in the Budget for the current fiscal year.
The data suggest that the revenue impact of lower rates was partly offset by higher consumer demand. However, October demand also reflected the pent-up buying after the government announced the impending rate cuts in mid-August. Collections may slow further in the coming months as the impact of pent-up demand fades.
E-way bill generation slowed sharply in October, suggesting a moderation in trade as the festival season ended and pent-up demand tapered off. E-way bills — GST documents for transporting goods worth more than ₹50,000 — fell to 126.9 million from a record 132.0 million in September. Year-on-year growth in e-way bill generation slowed to 8.2%, the weakest pace in three years. Although e-way bill generation typically peaks in October, this year it was the lowest in four months. The data suggest that GST collections may weaken further as the festival fervour subsides.
Manufacturing activity in India improved in October, buoyed by GST rate cuts. The HSBC India Manufacturing Purchasing Managers’ Index rose to 59.2 in October from 57.7 a month earlier, indicating a quicker improvement in sector activity. However, the level remained marginally below the 17-year high of 59.3 in August.
New orders increased faster, boosting output and purchasing activity and leading to a near-record expansion in input inventories. External sales rose at the slowest pace in 10 months, weighed down by higher US customs duties on Indian goods.
Selling prices, surprisingly, rose at the fastest pace in 12 years despite lower input cost inflation and GST cuts. Companies said they were able to pass on higher freight and labour costs to end consumers amid strong demand.
Services activity, however, slowed in October despite the tax rate cuts. The services PMI fell to a five-month low of 58.9 from 60.9 in September, but remained comfortably above the long-run average of 54.3.
The moderation was due to competitive pressures and heavy rains in parts of the country. New business intakes continued to rise, though at the slowest pace in five months. International demand for Indian services remained buoyant, but expansion was at the weakest pace in seven months.
Input costs of service firms rose at the slowest rate in 14 months. Unlike the manufacturing sector, output price inflation eased to a seven-month low.
The combined output of India's manufacturing and service sectors continued to expand sharply in October, though growth lost momentum. The HSBC India Composite PMI, a weighted average index of the two indices, moderated to a five-month low of 60.4 in October from 61.0 in September.
India’s electricity generation from conventional sources fell 10.8% year-on-year to 119.57 billion kWh in October, marking the steepest decline since June 2020, when output slumped during the COVID-19 pandemic. In absolute terms, electricity generation in October was the lowest in 11 months.
The decline was led by thermal power generation, which accounts for over 80% of India’s conventional energy capacity. Power generation from conventional sources, especially thermal plants, has been losing market share to renewables. The share of thermal energy in overall energy generation, including renewables, fell to 65.5% in September from 72.3% two years earlier.
Freight traffic handled by major ports rose 11.9% year-on-year to 76.37 million tonnes in October, led by higher crude, petroleum products and container volumes. Crude and petroleum product throughput increased 16.2% to 23.21 million tonnes, while container traffic rose 12.7% to 17.76 million tonnes. Overall freight traffic handled by the 12 major ports rose 6.6% year-on-year to 514.0 million tonnes in April-October.
India’s domestic air passenger traffic fell year-on-year for the third straight month in September, indicating continued fragility in urban demand. Passenger traffic declined 2.9% to 12.64 million in September, the sharpest fall in 44 months. In absolute terms, passenger traffic in September was the third lowest in 23 months. Domestic airlines carried 80.17 million passengers during April-September, up 1.0% from 79.35 million a year earlier.
Hotel occupancy rates in India stood at 61-63% in September, unchanged from a year ago but 1-3 percentage points above the August levels, according to HVS Anarock. Average room rates rose 9-11% year-on-year and 6-8% sequentially to ₹7,900-8,100 in September. Occupancy rates in the July-September quarter were at 60-62%, unchanged from a year ago but down 0-2% from the previous quarter.
India received a weighted average rainfall of 112.2 mm in October, the highest for the month in 12 years and 49% above the normal of 75.4 mm. Rainfall activity remained strong despite the end of the southwest monsoon season. In the post-monsoon period, rainfall has been over 60% above normal in half of the country.
The unseasonal rains have severely affected standing Kharif crops in many areas, especially paddy and pulses. With the Kharif harvest over, the acreage under Rabi crops has begun to rise. As of October 31, the area under Rabi crops was 7.58 million hectares, up 15% year-on-year. The area under pulses rose 26% to 2.08 million hectares, while oilseeds were up 13% at 4.23 million hectares.
The good rains have also kept storage levels in key reservoirs well above normal. As of November 6, the 161 reservoirs held 165.3 billion cubic metres, or 91% of live capacity — 6% higher than a year ago and 19% above the 10-year average.
The Indian Sugar & Bio-Energy Manufacturers Association has projected India’s gross sugar output in the 2025-26 (Oct-Sept) season at 34.4 million tonnes, marginally lower than the 34.9 million tonnes estimated earlier. Gross sugar output will, however, be 16.0% higher than 29.6 million tonnes in the previous season. Net sugar production, excluding diversion for ethanol, is estimated at 31.0 million tonnes, up 18.5% from 26.1 million tonnes last season. The closing stock of sugar at the end of the next season is estimated at 7.5 million tonnes, assuming no exports.
India’s foreign exchange reserves fell for the second consecutive week as gold prices eased from record highs. The reserves stood at $689.7 billion as of October 31, down $5.6 billion from a week earlier. Foreign currency assets declined $2.0 billion to $564.6 billion, while gold reserves fell $3.8 billion to $101.7 billion. Overall, reserves have risen by $21.4 billion so far in 2025-2026, primarily due to higher gold prices.
Reserve money growth accelerated to 2.4% year-on-year as of October 31, from 1.9% a week earlier. Currency in circulation rose 7.2% year-on-year to ₹38.20 trillion.
Gross direct premiums of general insurance companies, including stand-alone health insurers, were almost flat year-on-year at ₹296.18 billion in October. For April-October, premiums increased 6.1% to ₹1.95 trillion. The growth rates are not strictly comparable, as the Insurance Regulatory and Development Authority of India excluded long-term policy premiums effective October 1, 2024.
Exports of software services by Indian companies, excluding sales through overseas commercial presence, are estimated to have grown 7.3% in 2024-25 to $204.7 billion, according to a Reserve Bank of India survey. Computer services accounted for over two-thirds of total exports at $138.1 billion, followed by business process outsourcing at $55.8 billion and engineering services at $10.8 billion.
The US accounted for 52.9% of the IT exports at $108.3 billion, followed by Europe at 32.8% ($67.2 billion), Asia at 6.4% ($13.0 billion), and Australia and New Zealand at 2.4% ($5.0 billion).
Coming up
- Nov 12 – Consumer Price Index for October
- Nov 14 – Wholesale Price Index for October
- Nov 14 – Merchandise trade data for October
- Nov 28 – GDP estimates for Jul-Sep
Tailpiece
More From BasisPoint